
Trade with X-Ray Vision
See real-time market momentum with our color-coded Range Bar Frameworks.
Instantly see who’s in control with color-coded range bars and live force indicators.
Built to help futures traders make fast, confident decisions with precision.
Includes trend lines, VWAP, MACD, Volume vs Price histogram and more—prebuilt and ready to use.
Locked, clean charts that strip away distractions and simplifies every trade.
About Us
Turning Complex Charts Into Easy To Read Charts

Software
What Makes Our Chart Unique?
We don’t use japanese candlesticks, instead we use Range Bars.
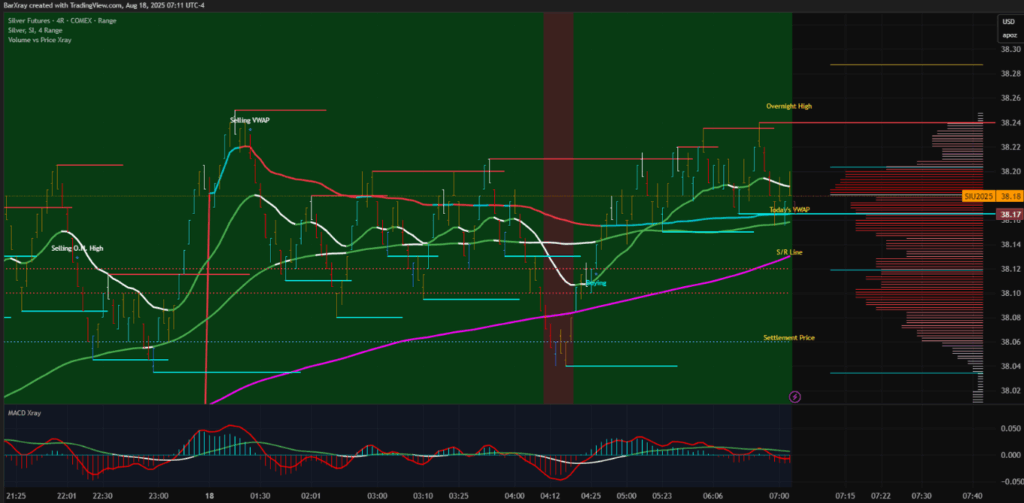

Range Bars within a total framework with the following indicators:
- A colored backaround indicates short term trend.
- Real time market generated information with colored bars.
- Words that indicate the current dominant force in the market.
- 2 SMA lines help identify turning points.
- The magenta Support/Resistance Line helps identify medium term trend.
- Today’s VWAP line helps identify longer term trend.
- Overnight High and Overnight Low price zones clearly marked.
- Approximate previous session Settlement Price for the instrument.
- Dynamic Support and Resistance yellow dotted lines.
- Dynamic lines help identify last High and Low prices.
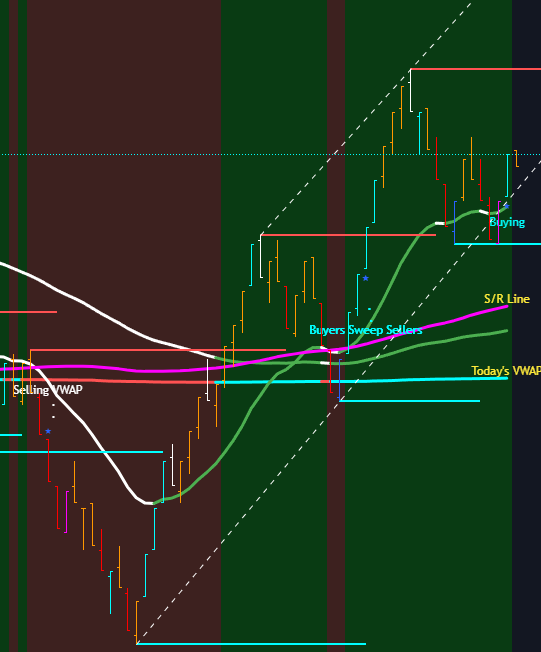
- Automatic dashed trend lines help identify the immediate trend.
- Free for life, an MACD that helps identify turning points and consolidation areas.
- Free for life, a histogram of Volume vs Price on the right hand side of the chart.
Take the First Step Towards Success
Ready to grow your trading or business with the Futures Market? Check all the instrument charts currently available. Contact us today if there is a specific instrument not yet available. We’re here to help!
EDUCATION
Learn What Works To Scalp The Futures Market
Please check the all the educational videos that explain the software and charts.
Under The Education Tab You Will Find Six Short Videos that explain the Framework.
- Introduction To The Future Market.
- Building The Workspace.
- The Trading Edge.
- Supply And Demand Zones.
- Completing The Workspace
- The Framework Provided And Trading Tips.
WHAT WE OFFER
Expertly Crafted Charts For The Futures Market
Discover the unique benefits of the Framework provided
for the Futures Market that set us apart from all competition.
Our team of experts bring years of experience in tarding Futures to our clients.
Solutions
We customize our services to meet your specific needs and goals by introducing new instruments as required by our customers.
Record
We have a history of delivering successful results and satisfied clients.
Your satisfaction is our priority, and we focus on providing exceptional service.
Strategies
We utilize the latest technology in our charts to ensure you stay ahead of the competition.
Prices
Transparent Pricing – No hidden fees or surprises, just clear and fair pricing for all chart instruments.
Let’s Make Your Vision a Reality
It’s time to turn your ideas into action. Connect with us today if you need a chart for a specific instruments not yet published. We’re ready to bring your vision to life!
Why Choose Us
Your Trusted Partner in Success
Our custom range bar charting are designed for precise intraday Future market analysis.
Easily assess market conditions with our intuitive, color-coded range bars and indicators.
Gain insights from a framework that makes it easy to instantly understand the dominant force in the market.
Enjoy continuous support to ensure you maximize the potential of our charts.
Obtained?
You need to register in order to log in as a registered user.
Under the education tab there are six videos that explain everything that is on the chart.
Available?
Unfortunatly no demo is available due to the many instruments in the Futures Market




FAQ
Most Popular Questions
Included in the Framework are the following indicators:
- A coloured background indicates short term trend
- Real time market generated information with coloured bars
- Words that indicate the current dominant force in the market
- 2 SMA lines help identify turning points
- The magenta Support/Resistance Line helps identify medium term trend
- Today’s VWAP line helps identify longer term trend
- Overnight High and Overnight Low-price zones clearly marked
- Approximate previous session Settlement Price for the instrument
- Dynamic Support and Resistance yellow dotted lines
- Dynamic lines help identify last High and Low prices
- Automatic dashed trend lines help identify the immediate trend
- An MACD that helps identify turning points and consolidation areas
- Histogram of Volume vs Price on the right hand side of the chart.
The Framework only works in the TradingView Platform. If you do not have an account with TradingView you can use the following link to obtain a bonus click here.
Yes, but to get live data you need to subscribe to a paid plan and contract live data.
You will need to subscribe to at least the Essential Plan.
You can subscribe here and obtain a bonus click here.